Overview
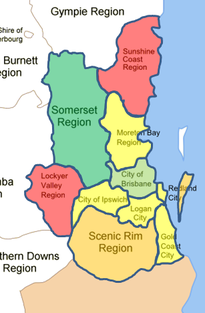
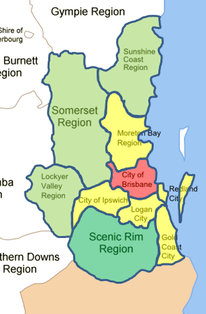
To demonstrate the potential of the disaster resilience index, we have applied the index to 11 Local Government Areas in the Greater Brisbane Area; Sunshine Coast, Moreton Bay, Somerset, City of Brisbane, City of Ipswich, Logan City, Redland City, Gold Coast City, Scenic Rim Region and the Lockyer Valley Region. Using the index we have identified the comparative resilience level of each of these regions. This information has been utilized to generate a colour scale ranging from red (least resilient) to green (most resilient) using standard deviations from the average and the results overlayed onto a map of the region.
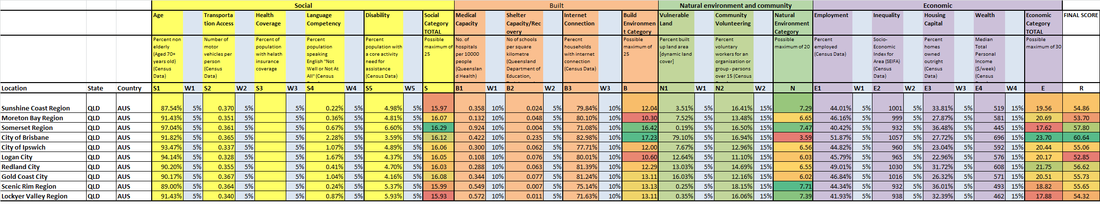
Calculation of the disaster resilience index for 11 Local Government Areas within Queensland with data obtained from the Australian Bureau of Statistics.
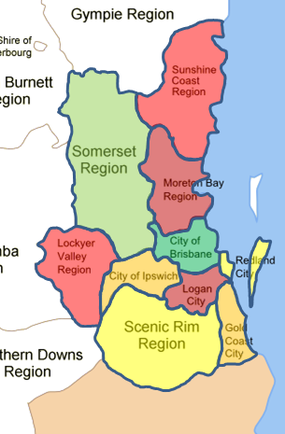
The disaster resilience index overlayed on the Greater Brisbane area with divisions by local government areas.
|
Through mapping the final indicator scores on a regional map of the Greater Brisbane Area we see the relative range of performances of each local government area. Further analysis of the tabulated results shows comparative strengths and weaknesses of different areas.
The City of Brisbane performs best overall, with a final total of 63.85, followed by the Somerset region with a final total of 61.13. It can be noted from the tabulated data that while both of these localities performed very well in more than one area, each was noticeably weaker in one indicative area, with the City of Brisbane scoring comparatively low in the area of Natural Environment and Community, while the Somerset region ranked lowest in economic resilience. Logan City is the worst overall performer, with a final total of 56.02, followed by the Moreton Bay region with a total of 56.86. It is also noted that while each of these local government areas underperformed in at least one area, they were not the worst performers across the board, with the Moreton Bay Region ranked third in the Economic category. The inspection of indicators in different environments (see below) presents a holistic view of the resilience of an area, and demonstrates the multifaceted nature of the components which contribute to resilience. |
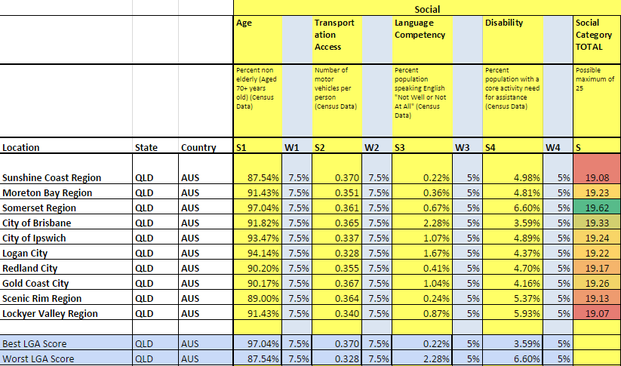
Social Category Results
|
The highest performer in the Social Environment category is the Somerset region, with a category total of 19.62. This is contrasted with the worst performers in the Social Environment sector, the Sunshine Coast region with a total of 19.08, and the Lockyer Valley Region with a total of 19.07.
The results of the social category are most heavily influenced by the relative size of the elderly population and by access to private transportation, thus increasing the Somerset region's score by a substantial amount in relation to other localities. |
Natural Environment Category Results
|
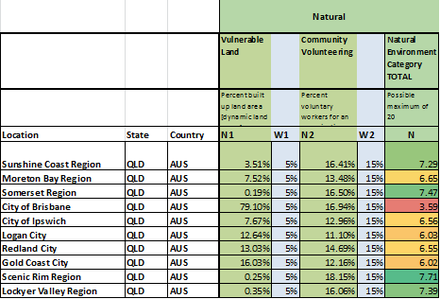
The Natural and Community resilience indicators encompass both community involvement and vulnerable land, with areas of high urban density being considered less resilient due to increased potential impact to infrastructure and lives. The urban density has a large impact on the index of the City of Brisbane, resulting in the lowest score of 3.59. A number of other areas benefit from a decrease in density in addition to high rates of community involvement, with the Sunshine Coast, Somerset Region, Scenic Rim and Lockyer Valley all scoring scores above 7.
|
Built Environment Category Results
|
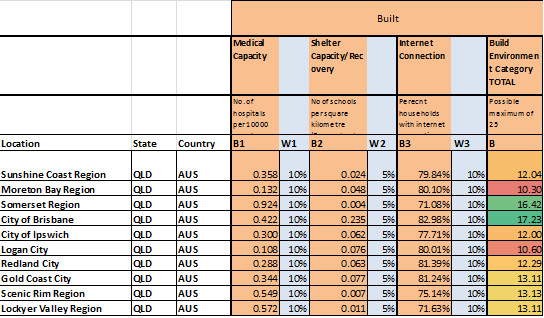
The built environment category shows a strong correlation with overall performance, with medical capacity and Internet connection acting as the strongest influences to the category total. The City of Brisbane performs strongest in this category, with a category total of 17.23 contributing to its overall score of 63.85. The lowest totals occur in the Moreton Bay region with a total of 10.30, and Logan City with a total of 10.60. Both these totals are a result of a lower medical capacity than the stronger performing localities of Somerset and the City of Brisbane.
|
Economic Category Results
|
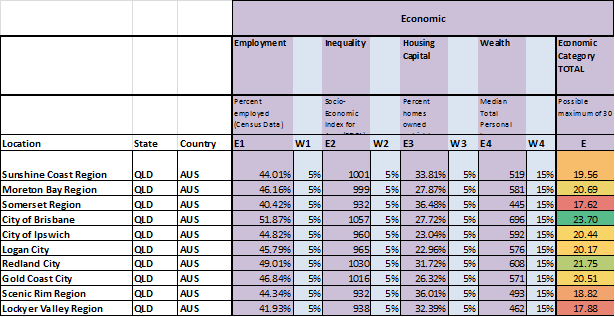
The economic category presents an important component to the disaster resilience index and displays a strong correlation with overall performance. The one exception to this rule is the Somerset Region, which is the worst performing region economically with poor comparative performance in employment levels, inequality and wealth. As may be expected, the Lockyer Valley region and the Scenic Rim region also rank as more economically vulnerable. The City of Brisbane demonstrates the highest level of economic resilience (23.7) followed by the Redland City (21.75) and Moreton Bay regions (20.69).
|
Case Study: Somerset Region
Perhaps surprisingly, the Somerset region ranks second overall with a final disaster resilience score of 61.13. Despite comparatively the worst performance in the economic category with bottom place scores for the employment, inequality and wealth indicators, the region displayed strong results in the social, built and natural environment category. By using a disaster resilience index, our holistic approach reveals that the resilience of this region is significantly greater than would be expected if one examined economic performance alone. Indeed, Somerset region has a young age demographic and an extremely small proportion of the population who are illiterate. Further, Somerset has the greatest number of hospitals per 10,000 people; offsetting economic resilience with social and built environment resilience.
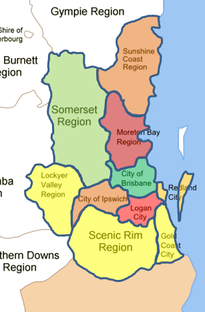
Performance of the 11 Local Government Areas mapped according to performance in the 4 index categories; social, natural, built & economic.
SOCIAL category results
|
NATURAL category results
|
BUILT ENVIRONMENT category results
|
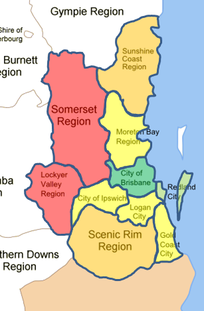
ECONOMIC category results
|
Conclusion
The disaster resilience index presents a powerful tool which may be used to reveal the relative resilience level of any region worldwide. Due to its consideration of a wide variety of factors from the social, natural, built and economic spheres of society, individual attributes can be compared to those of the surrounding area with the overall index, demonstrating the ability of different areas to withstand and recover from adverse events and climate extremes. This index may therefore be seen as a tool which can be utilized to identify areas of vulnerability leading to the strengthening of resilience via targeted economic, technological, political and social strategies.
|
-How our disaster resilience index may be used to assist social, economic, technological and political strategies aimed at enhancing resilience.
|
-A comprehensive list of primary and secondary sources utilized in this investigation.
|
-About the authors
-The Australia-Netherlands Water Challenge |
