
Introduction
The PBL Netherlands Environmental Assessment Agency suggests that climate changes will be more gradual in the Netherlands compared to other regions. However, the risk of flooding, drought and precipitation extremes is likely to intensify (PBL Netherlands EAA, 2012). Annual precipitation has increased by 20% over the last century in the Netherlands and heavy rainfall has become more frequent (PBL Netherlands EAA, 2012). It is thus imperative to develop approaches and tools to increase resilience in communities which face these changes.
Resilience & Vulnerability
In this case study application for the Greater Amsterdam region, resilience is considered to incorporate three key functions; coping capacity, damage potential and the ability of a community to “bounce back” from a stress or disturbance. These concepts have been reflected in the indicators selected within the resilience index utilised in this study.
What Is The Flooding Disaster Resilience Index (FDRI)?
The Flooding Disaster Resilience Index (FDRI) is a single figure summarising a region’s status on 11 indicators hypothesised to influence the resilience of a region to a natural hazard. The index allows comparisons of metropolitan regions to be made and thus relatively strong or vulnerable regions to be identified. The FDRI index can be summarised by the equation below:
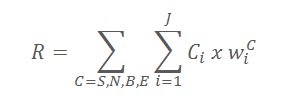
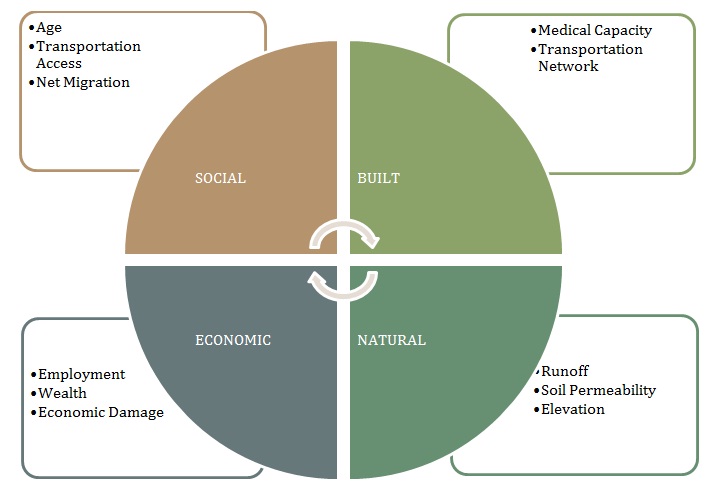
Where C represents the indicator category for the Social (S), Built (B), Natural (N) and Economic (E) environments, i represents the indicator and J represents the total number of indicators within the respective category C. Wi represents the weighting factor utilised for each indicator. The specific details for the complete list of indicators utilised in the index are visually depicted in the following schematic.
FDRI Calculation & Integration with ArcGIS
All selected indicators were merged into one single layer file using the ArcGIS union tool. The union tool computes a geometric union of the input features with all features and their attributes written to the output feature class.
The FDRI was then generated as a field value in the combined layer file using the field calculator tool and both the normalised indicator scores and the weighting factors. VB scripts were used to quantify the runoff potential, soil permeability and economic damage indicators from a categorical value to a numerical value.
A colour ramp was then applied for the FDRI calculation using a total of 32 classes and a graduated colour scheme from red (least resilient) to green (most resilient). The graduated colour renderer is one of the common renderer types used to represent quantitative information—especially for polygon feature classes. Within a class, all features are drawn with the same colour, with each class assigned a graduated colour from smallest score (red) to largest score (green).
Results: Visualisation of Resilience
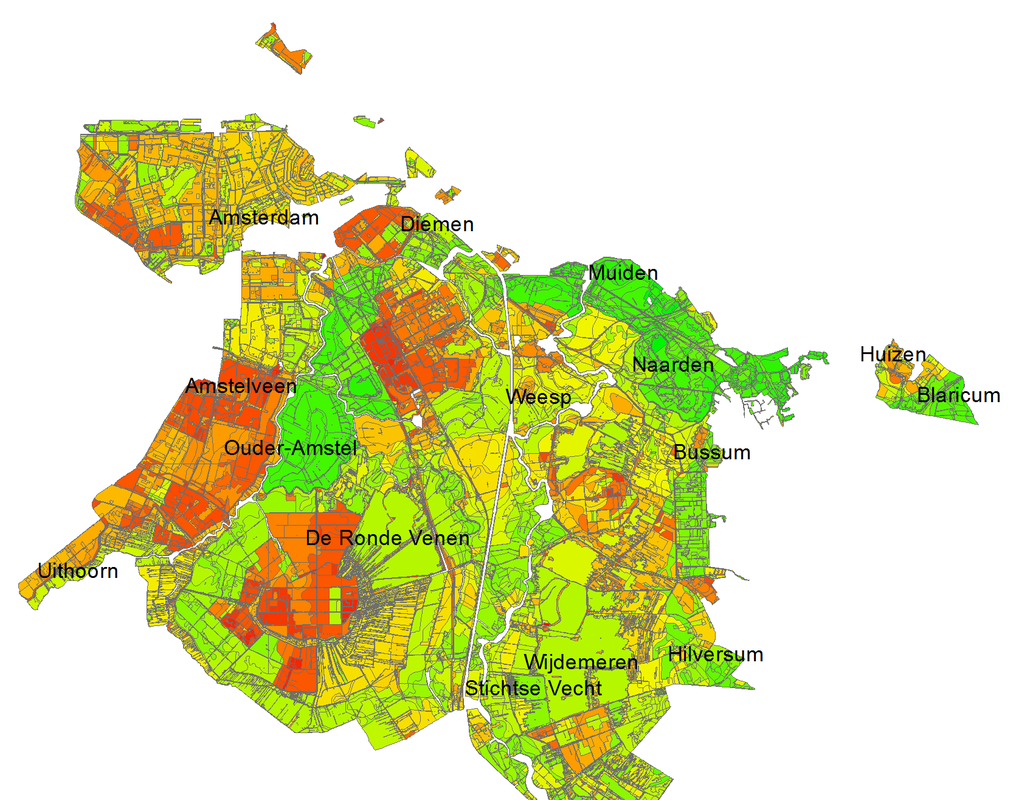
The following figure below, depicts the ArcGIS layer generated to visualise the overall Flood Disaster Resilience Index (FDRI) output for the 16 municipalities under investigation.
Discussion
The Flooding Disaster Resilience Index visually identifies areas that are comparatively more or less resilient in certain fields. Analysing the differences between different areas, both overall and within the different indicator environments, provides a holistic view of strengths and weaknesses, and highlights potential areas for improvement that have the greatest potential impact. Through visual analysis, it appears that no individual area performs strongly in all of the 11 indicators selected, and likewise, no individual area performs weakly across all indicators.
The impact of the indicator weighting process plays a large part in some of the indicator results, with age being weighted 46% within the social environment category and therefore having a higher influence on social resilience than either net migration or access to private transportation. This leads to some understandable differences, whereby the municipality of Amsterdam, with a high percentage of the population falling between 15 and 65 years of age, performs relatively strongly in the social environment category despite relatively high net migration and low access to private transportation.
The overlap of indicator areas has some observable consequences for certain indicators, particularly the medical capacity of an area. The catchment area used for hospitals was selected as 20 km, therefore the overlapping areas are visually separated by other factors. For medical capacity, the population of adjacent areas can have a cause great divergence of apparent medical capacities due to differing population densities, as is particularly apparent between Amsterdam and its neighbouring area Diemen, with similar numbers of hospitals but differing population densities.
The index in its current state does not consider the risk or likelihood of a particular area experiencing a flood, however has more of a focus on the damage potential and the ability of communities to respond in the event of a flood. As this is a major limitation of the index, the FDRI is designed to be used in conjunction with existing tools and metrics, including risk analyses and flood protection ratings, to give a more thorough overview and holistic approach to flood management. The index is more reflective of how resilient communities would be when a flood event occurs, rather than considering the risk of the event itself.
Overall, the regions of Naarden, Muiden, Blaricum and Hilversum were revealed to be more resilient to a potential flooding event. Contrasting this, the regions of Amstelveen, Amsterdam and Uithoorn were revealed to be areas of potentially higher vulnerability.
