Why use a composite index?
Composite indicators are widely agreed upon as significant tools in providing a holistic assessment. The vast literature on composite indicators contains many methodological approaches for index construction and most of the literature emphasises the need for a multi-step process of indicator construction. Davidson & Shah (1997) promote composite indexes as a useful tool to measure complex, multi-dimensional concepts that cannot be observed directly. Schneiderbauer (2004) also advocates the use of composite indicators due to their ability to incorporate data from a range of fields and minimise measurement error. Moreover, the ability to synthesize a vast amount of diverse information into a simple, easily usable form has meant that indexes are widely used across many disciplines (Davidson & Shah, 1997). The plethora of existing indexes is acclaim to the usefulness of the composite index form (Cutter et.al, 2010).
Measuring Resilience
We have selected the minimum number of indicators we believe are required to present a holistic overview of resilience in the face of climate extremes. We have broadly followed the following framework presented in a discussion paper prepared for the department of sustainability, environment, water, population and communities. Within the discussion paper, Thomas et.al. (2013) outlines that the following steps are necessary to develop a model to measure community resilience. We have focused on steps 1, 2, 5 and 6 in the formation of our composite resilience index.
1. Setting framework or model parameters (determination of study area, targeted outcomes, data requirements)
2. Measuring antecedent or current conditions (community profile and hazard profile to understand inherent vulnerability and resilience in social systems, natural systems and the built environment)
3. Risk analysis (assessment to look at frequency, duration, intensity, magnitude, and rate of onset for hazards)
4. Understanding risk response (formal and informal coping mechanisms)
5. Determination of vulnerability indicators and required data to measure indicators
6. Weighting of indicators and sensitivity analysis
7. Vulnerability assessment or modelling.
Our Rationale
There is a consensus within the research community that resilience is a multifaceted concept, which includes social, economic, institutional, infrastructural, ecological and community elements (Bruneau et.al, 2003). Based on these findings we have identified indicators falling within these subcategories in which it is evident that the greater the strength within these areas, the greater the populations' resilience and adaptive capacity in the face of natural hazards and a changing climate. All selected indicators have been grouped under one of the four resilience environments – social, built, natural or economic – and these groups will be used as sub categories for the proposed resilience composite index. The combination of these individual indicators with applied weighting factors comprises our composite resilience index.
All raw data variables have been converted into comparable scales utilizing percentages, per capita and density functions to ensure standardization.
All raw data variables have been converted into comparable scales utilizing percentages, per capita and density functions to ensure standardization.
Determination of Weighting Factors
Weighting factors for each of the indicators were determined via a consultative process. For the Netherlands application, a number of experts from Waternet were surveyed, whilst secondary input was also provided from Royal HaskoningDHV and the Australia-Netherlands Water Challenge participants. The 18 participants were asked to rate the indicators within each category, with 1 being the indicator they perceived to have the highest correlation to resilience up to n (the lowest correlation with resilience), where n is the total number of indicators within the category. Each of the four categories (social, built, environmental and economic resilience) were then ranked, with 1 indicating the category with the highest significance to the concept of resilience, and 4 indicating the lowest importance to resilience. Each of the surveyed rankings for the indicators were then averaged to provide an overall averaged rank.
The four categories were assigned weightings using the Rank Reciprocal Method (Buede, 2008)
The four categories were assigned weightings using the Rank Reciprocal Method (Buede, 2008)
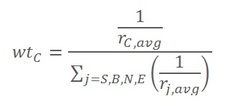
where rC,avg represents the average rank of category C, and j represents each of the four indicator categories including social (S), built (B), natural (N) and economic (E) environments.
